
How it Started
In 1978 I left Scientific Products and joined Clinical Assays headquartered in Cambridge, MA. I was hired to sell Radioimmunoassay (RIA) kits to hospitals. These kits all required the user to perform the following steps:
- Prepare a set of standards, typically in 12 x 75mm tubes.
- Add tracer, incubate, and then decant the tracer (ligand attached to an I125 atom.)
- Count the samples on a gamma counter.
- Transfer the data from the standards (i.e., the counts of each tube) and plot on a piece of logarithmic graph paper, X-axis = dose, Y-Axis - response (count of the photons emitted).
- Draw the dose response curve, typically with a flexible ruler.
- Interpolate the unknown sample’s dose from the graph.
Clinical Assays had a particular advantage over its competitors in that the antibody was, in most cases, coated to the wall of the 12 x 75mm tubes. This feature made it easy to separate the bound fraction from the tracer simply by dumping out the liquid. The vast majority of these assays used I125 (a weak gamma emitter) as the tracer, so if you didn’t swallow the tracer, there was no radioactivity.
All of this work coincided with the early days of the small computer revolution. Texas Instruments released the now famous TI-59 calculator in 1977. Apple computer released the Apple II that same year and IBM released their first PC in 1981. Everyone who worked in a laboratory wanted one. Everyone who did immunoassays wanted the time consuming and error prone manual process of drawing and interpolating dose response curves to be done on a computer.
My goal was to be the first to solve both of these problems:
- Sell a lot of RIA kits by providing a computer with a reagent rental contract.
- Write a computer program on my Apple II computer (purchased in 1979) that would do the job.
That vision started me on a journey that would end in 1997 with a whole lot of plot twists.
Figuring Out I Should Have Taken More Math Courses
I soon discovered that Dr. David Rodbard and James Munson at the NIH had tackled this problem back in the early 1970’s - before computers were invented. Because dose response curves aren’t linear, another equation had to be developed. With the TI-59 in mind, they developed the 4-Parameter Logistic (4-PL) curve fitting equation:
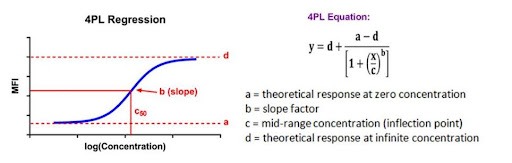
Having taken a pre-med curriculum in college, I had no math courses. The limits of my math training was trigonometry in high school. I had a lot of self-learning to do. So I reached out to a math professor at Carnegie Mellon University for assistance. He supplied the Basic code and I was ready to start selling RIA kits with computers! Working with him I quickly learned a lot about the math involved.
The 4-PL has stood the test of time. While it has its faults and limitations, it is still the gold standard used in competitive binding assays worldwide and in drug discovery.
Along Comes IRMA Just to Confuse Things
Immunoradiometric assay (IRMA) is an assay that uses radiolabeled antibodies. It differs from conventional radioimmunoassay (RIA) in that the compound to be measured combines immediately with the radiolabeled antibodies, rather than displacing another antigen by degrees over some period.


In layman's terms, this reduces the number of steps in an assay. This technique launched the non-isotopic conversion trend and is today how most ELISA assays are performed.
When people started putting their data produced from IRMA assays into my 4-PL computer program, I started getting complaints from users that the program wasn’t producing the correct answers. Understanding why this was the case was beyond my ability. But it was a problem not too tough for Dr. Rodbard or the NIH to tackle! So they came up with the 5-PL:
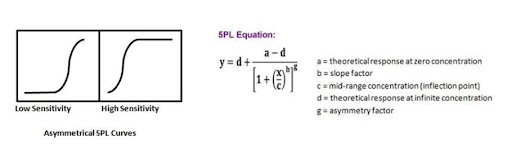
The problem with an IRMA assay was that unlike standard RIA curves, IRMA assays were asymmetrical. It was further complicated by standard doses that spanned over 5 or more logs of concentration.
I was now on the hunt for a better curve fitting algorithm. Ideally, this would be a method that would handle both competitive binding as well as IRMA assays. Fortunately, when the wrong answer was produced, it was not off by a little - it was off by a lot. The good news here is that docs weren’t being given erroneous answers - or at least I hoped that was the case.
Leveraging My Expertise to Advance My Career
Since this is the tale of my journey in data reduction, I won’t bore the reader with too many details of my career path. Suffice to say that armed with an Apple program that did data reduction, I was sought after by gamma counter manufacturers who wanted to add this to their instruments. The first was Berthold Analytical Instruments (1985 - 1988), Laboratory Technologies, Inc. (1988-1989) and then Packard Instrument Company (1989 - 1997).
In each of these companies I observed the same thing happening: No matter who did the programming, the 4-PL algorithm gave the same erroneous answers on certain data sets. These were most pronounced on IRMA assays. It was clear to me that the world needed a better curve fitting algorithm.
Packard vs. LKB Wallac
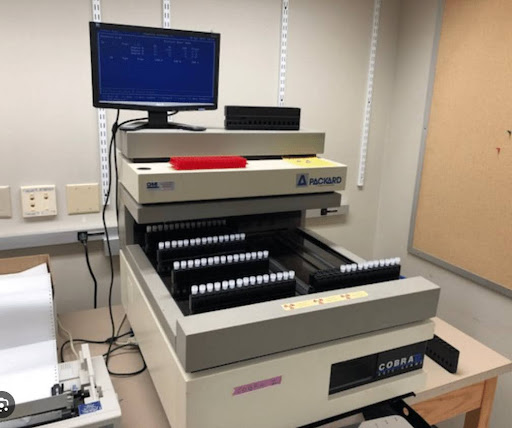
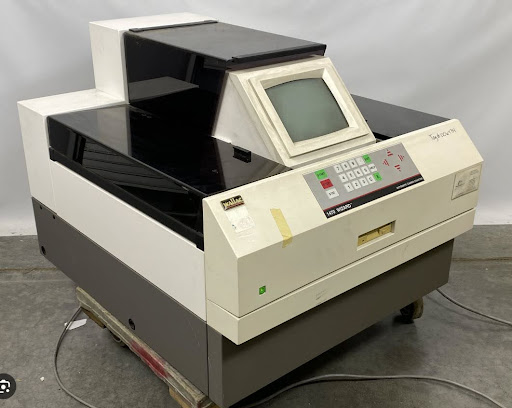
As Senior Product Manager for Gamma Counters at Packard Instrument Company (later Packard Biosciences) my job was to market the Cobra (shown in the photo at left). Our arch enemy was LKB Wallac - a company based in Turku, Finland who released the Wizard around 1995.
There were two schools of thought playing out at these two competitors:
Packard - Internal, PC based proprietary computer, through-hole crystal detectors.
Wallac - External PC based, software sold separately, well-type detectors.
From a software standpoint, Wallac’s software had always offered multiple types of curve fitting algorithms where Packard offered just one - the 4-PL. Wallac offered a spline fitting method that seemed to work better on IRMA assays.
Packard needed more, and hopefully better, curve fitting methods to compete with Wallac. And so in 1993, I made my first journey to Moscow, Russia. While there, I was introduced to Sergey Fedotov, the chair of the Physics and Mathematics departments at Moscow Engineering and Physics Institute (MEPHI).
Russia in the 1990’s
My first trip to Russia was to train our new Russian team on the Cobra gamma counter. The Soviet empire had only disintegrated a couple of years before I arrived. The transformation of Moscow from the Soviet days had yet to begin. It was the coldest, least colorful, most foreboding place I had ever been to. Apparently I wasn’t the only one who felt that way. When the plane’s wheels lifted off the runway at Sheremetyevo, a cheer went up from every passenger on that plane. It was like being released from prison.
Each time I returned to Moscow in the five years I ran the research project, it was like visiting a different city. Change was happening at an astonishing pace. Not all of it was the good kind. On my visit in 1993, Russian tanks shelled their parliament building. Boris Yeltsin had performed a self-coup while I was in the hotel right down the street from where this happened! I was there on April 19, 1995 when the Oklahoma City bombing happened. I was there on July 27, 1996 when the Olympic Park bombing happened in Atlanta where my son was in attendance. It seemed every trip was accompanied by some major event!
The facts that pertain to this story are:
- Russians back then treated U.S. citizens with great respect and admiration. Their feeling was that any day the U.S. would arrive in Russia with a Marshall Plan which would turn them into modern day German democracy.
- Russians had a great deal of prejudice. The Russian Orthodox church thought the U.S. evangelicals were wading into their territory. The Russians hated Finland. Moscow had a strong rivalry with St. Petersburg. Russians had great animosity towards Russian Jews who had immigrated. Russians treated Ukranians and people from Baltic countries with little or no respect.
- It was the most chauvinistic society I had ever witnessed.
- There was no one to do the little tasks such as clean the sidewalks of snow or the dirt from hospital stairwells.
- There was no toilet paper - just strips of newspaper next to the toilet which had no seat. You sat directly on the porcelain. (Note: The heat in most public bathrooms was turned off during the winter months.)
- There were no banks and the currency of choice was U.S. money. However, if a policeman caught you buying anything with U.S. currency he was authorized to confiscate your money and keep it for himself.
- Russians were just learning how to drive western cars and there were car wrecks everywhere.
- Moscow has the widest streets anywhere in the world. They were built so that missiles and army vehicles could easily maneuver.
- Every restaurant in Moscow (maybe Russia as a whole?) closes promptly at 8pm sharp.
- Russians have the ability to ingest copious quantities of vodka without passing out and still, incredibly, feel they are OK to drive.
- Russian customs require you to display all of the currency in your possession when you arrive, in full view of the Russian public via a glass wall!
Back to the Data Reduction Journey
What’s the problem?
You may be asking at this point, what was the problem that I had spent all this time and effort trying to solve?
The problem was that the curve fitting methods at the time sometimes gave incorrect results. I knew this because I was receiving data sets from customers that confirmed their complaints. Packard’s QC department had compiled a large portfolio of these data sets from customers all over the world.
In most cases, when a customer obtained an erroneous result, they had to repeat the assay. This extra test was expensive, time consuming and frustrating because the clinical results were delayed.
The inaccuracy was in the unknown sample dose interpolation, which could be confirmed by hand-drawing the standard curve on graph paper and interpolating the dose manually. In most cases, the results were simply absurd. But there were occasions when the results were off just enough that an incorrect diagnosis could be made if the clinician trusted the result to be accurate.
Armed with this large portfolio of data sets, it was a simple matter to run them through data reduction programs produced by other companies such as Wallacs. They could also be run through different algorithms, such as the Cubic Spline method which was also an option in the Wallac software.
All of the 4-PL methods yielded the same incorrect results. Other methods, such as the Cubic Spline, did not. It should be noted here that the Cubic Spline method had a completely different set of issues associated with it. The problem was that assays with concentrations that spanned many logs of concentration with some approaching zero, it was well known that the Spline method could yield incorrect results. Documentation provided with the Spline method warned people of this known problem.
So the options customers had were:
- Keep a sharp eye out for aberrant results, and if encountered, fudge the data by eliminating or altering standard data (e.g., deleting one of the duplicates or a standard altogether.)
- If an aberrant result is encountered, rerun the data using a different algorithm such as the Cubic Spline if available. (Many gamma counters did not offer alternative algorithms.)
- Repeat the assay and most lilley run the standards in triplicate and hope for normal results.
Keep in mind that all of this was going on at a time just after the Three Mile Island accident in 1979 which prompted companies to develop non-isotopic assays. The problem with inaccurate results was perceived to be related only to isotopic assays. It wasn’t of course, but it served as another incentive to speed the switch to non-isotopic assays, which would eventually greatly reduce the need for isotopic instruments which, of course, is what I was being paid to promote.
What were the possible solutions to solve this problem?
- If you were manufacturing instruments with software that only provided results using the 4-PL algorithm (like Packard), the solution was to improve the algorithm or provide alternative, superior methods.
- If you were providing software with multiple curve fitting methods to choose from (like Wallac) the answer was to provide more alternatives that did a better job than the 4-PL or Spline.
- I didn’t realize it at the time but there was a third alternative which was simply do nothing and let non-isotopic assays and “black box” analyzers be developed.
Since I was working for Packard as the product manager for Gamma Counters, I went with option 1. I had the backing of senior management and the engineering team primarily because, for years, we had lost sales to Wallac because they offered more algorithms and used this as a lock-out specification in RFP’s.
The Impact of High Throughput Screening Drug Discovery
By the early 1990’s, the clinical market for isotopic assays was a thing of the past. Non-isotopic assays and analyzers had by now reduced gamma counter sales in the clinical market to near nothing. However, the pharmaceutical and research market still relied heavily on isotopic methods, both gamma and beta counters. Packard’s Tri-Carb was, for many years, the best selling beta counter in the world.
Pharmaceutical companies were entering the phase we now look back on as “High Throughput Screening”. There were extensive libraries of compounds on hand and the goal was to supply a target, such as kidney tissue, expose it to thousands of compounds and look for compounds that bound to the target. The harder they bound, the higher the priority that they would be a good drug candidate worth exploring further.
These were all ligand binding assays done by the tens of thousands, and were no different than the kits we developed at Clinical Assays two decades before. The measure of the binding was based on the estimated dose at 50% (ED50) binding which conveniently was the “a” parameter in the 4-PL.
So the thinking at the time was that if Packard could come up with a more accurate way to estimate the ED50 then drug companies would prefer Packard screening systems to the competition. This is still the methodology in use today.
In other words, Packard had both short term and long term reasons to want to solve this problem at that time. At least that was the way it appeared.
Finding a Solution
Step 1: Find someone who could do the math at a budget price.
This takes us back to Russia. While working with Oleg, our Russian manager and demonstrating the use of the Cobra II gamma counter, I told Oleg of my quest to find a solution to the 4-PL problem.
Oleg had attended MEMPHI and had Dr. Sergey Fedotov as his professor. He told me that he was one of the most esteemed mathematicians in all of Russia and that he could introduce us. He located a interpreter and we had a very encouraging initial meeting where I learned:
- Since the fall of the Soviet Empire, higher education was not a priority; his salary, due to the devaluation of the Ruble, was equivalent to $60 per month.
- He told me that he was driving a 30-year-old Russian car, whose windshield wipers he had to remove when it was parked to keep them from being stolen.
- He told me about the math problems he had worked on - such as calculating the orbital decay of satellites due to the effect of solar wind among many others, none of which I had a clue about.
So I made him an offer:
- Solve the 4-PL problem and he would be paid a flat fee of $10,000 US upon completion and verification by our engineering team that it worked. This would be paid, by me, in cash, on my next trip to Moscow.
- Document every step of the math using MathCAD and provide code in C++. We would provide the MathCAD software.
- Document every step in the code in English.
He accepted and I went home not knowing if anything would ever come out of this arrangement. If it didn’t, we hadn’t spent anything so it was a low risk gamble.
Less than a month later, we received an email with the MathCAD files and the C++ code. We did the testing and confirmed that he had solved the problem. It handled our entire library of aberrant data sets flawlessly.
Needless to say, this result exceeded our wildest expectations. And we were eager to give Sergey even tougher problems to solve. Our next task was to decide what we wanted him to work on next and for me to strap $10,000 in currency to my waist, get on a plane and get safely through customs and into Moscow and pay Dr. Fedotov and his team without being observed by any Russian cops. Amazingly, this exchange went off without a hitch, thanks to the armed guard who accompanied me from the minute I stepped outside of customs in Moscow.
I asked him the obvious question - how did you do it? The answer was dumbed down to my level but essentially he confirmed that “Linear Algebra” was used to estimate the “a” variable in the 4-PL - the non-specific binding. Nearly always, the non-specific binding was assumed to be zero. People skipped this step to save time and money on reagents, which they continue to do today. As it turns out, setting the variable to zero can and does cause the problems people were seeing in the data sets. His linear algebra calculated an estimated non-specific binding value that made the whole equation more stable.
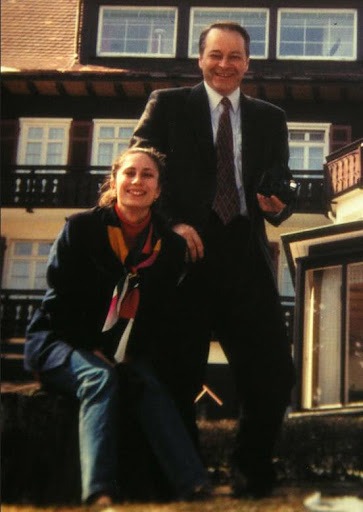
Dr. Fedotov and our interpreter, Tatiana Kuznetzova
Finding More Solutions
Over the next two years, we worked on several other projects using the same payment incentive structure. In each case, he solved the problem in what appeared to be an impossibly short amount of time and in each case, his work was confirmed to be spot on accurate by multiple experts we consulted with here in the U.S. including ligand binding experts at Duke University and Glaxo SmithKline (GSK). These include:
- Developing a Spline Fit that was constrained, and was able to handle 5 or more logs of concentration approaching zero. COMPLETE, AHEAD OF SCHEDULE
- Developing a replacement for Monte Carlo simulations to determine the Kd and Ka values simultaneously for up to 4 receptors and 4 ligands simultaneously. This project was requested by the Glaxo researcher after meeting with Dr. Fedotov. COMPLETE, AHEAD OF SCHEDULE
These projects were fully documented in MathCAD, fully described in English and accompanied not only C++ code but by Excel add-ins that allowed anyone to do these calculations from within Excel.
Dr. Fedotov learned enough English for us to converse on this project within the first six months we worked together, an impressive feat of intellect. We are still friends today. I should also mention that a few years ago, Dr. Fedotov told me that by providing him with MathCad in the early 1990’s had revolutionized how mathematics was being taught in Russia, and that it was now the educational standard there.
What do we do with this ground-breaking code that we developed?
It’s now 1996 and at a cost of nearly $50,000 inpayments, bonuses, travel and expenses,Packard had their hands on software that would ensure their place at the top of every big Pharma wish list.
During this time I had been assigned an additional role in the company - Software Product Manager. I had recommended to the company that they develop a software platform based on SQL Server technology that would allow multiple instruments to feed results directly into a large database rather than being “islands of information” stored on each instrument. The company had agreed to this approach and the project was termed Chronicle software. This would also allow remote monitoring of the instruments. (This was in the days when remote computing was just introduced.) Chronicle was the ideal vehicle to include Dr. Fedotov’s work! It was widely felt - and confirmed by many focus group meetings with big Pharma customers - that Packard was headed for dominance in high-throughput screening instruments.
It all depended on the software engineers at Downers Grove, IL. A meeting was arranged, at which Dr. Fedotov would present his work to the engineering team and answer any questions they had. Getting Dr. Fedotov's visa and permission to leave Russia took weeks and a couple of cases of vodka to convince a Russian General to sign off. But we got it done and the date was set for the meeting.
The Meeting
We all showed up in Downers Grove, Illinois. Dr. Fedotov began the meeting through our interpreter, demonstrated each piece of software, and the MathCad documentation. It went off without a hitch. We knew it would because all had already undergone extensive testing.
The software engineering group had a new leader, who I had only met briefly once before. He spoke with a thick Russian accent; I knew he was a Russian Jewish immigrant. I figured he and Dr. Fedotov would run up my tab for Vodka after the meeting adjourned.
What I did not know was that Packard’s new Russian head of software engineering was from St. Petersburg. I did not know that there was a huge rivalry between St. Petersburg and Moscow mathematicians. I found out that they literally hate each other. Dr. Fedotov was on the wrong side of this equation.
The software engineers adjourned for a private meeting. We all drank coffee for the 30 minutes or so they were gone, and when they came back into the room, we got the shock of our lives:
“This code is so complex that we can’t understand it. If we can’t understand what is going on, we can’t support it. If we can’t support it then it can’t go into a product. It’s a hard no.”
I looked to Senior Management for some support. After all, they had invested a lot of money in this project. It was clear the engineers had them on their side. No help there. In fact, a couple of weeks later the entire Chronicle project, well under way for over a year, was cancelled.
Less than a year later in 1997, I resigned from the company. This software, owned by Packard, which was later acquired by Perkin Elmer, has been on a shelf somewhere for over 30 years until it was published independently by Dr. Fedotov. This paper can be downloaded from Dr. Fedotov’s link provided earlier.
How did Perkin-Elmer end up owning Packard Biosciences?
A company called EG&G had acquired Berthold Instruments (also my former employer) as well as LKB Wallac. They later purchased Perkin-Elmer and changed their name to Perkin-Elmer. Perkin-Elmer then purchased Packard Biosciences in June, 2001. With the two old rivals now a part of the same company, the Wizard was chosen as the only gamma counter that would be sold by Perkin-Elmer. The Cobra was officially dead. I was asked by one of my former employees how I felt about that. I told him I couldn’t care less.
For many years, Packard’s principal owners, Emory Olcott (CEO) and Richard McKernan (President) had told employees that their plan was to take Packard public; they asked for every employee's help to make that happen. As further incentive, bonuses were paid in stock options. In the 10 years I worked there, I had accumulated enough stock options that I could, with any luck, cover the college expenses for my two children. Many other longer-term employees had accumulated far more. In April of 2000, Packard Biosciences became a publicly traded company. Their stock went public at around $10 per share. All of my stock options were at $10.25 per share.
The stock price climbed to a high of around $22 per share over the next year. However none of our options could be exercised until 1 year after going public. One year later, and before our options could be exercised, the two top executives were permitted to sell their shares, they did so on the same day driving the price of the stock to under $5 per share. EG&G, now Perkin-Elmer, promptly bought the majority shares and the stock was delisted. Mr. Olcott is a multi-billionaire and Mr. McKernan’s net worth was approaching one billion when the stock was sold, rendering all of the employees’ bonuses that made this move possible worthless. In addition, these stock options had been given to many customers in the Nuclear Power industry. The stock sale yielded both of them in excess of $500 million.
How does the sale of the company relate to the data reduction journey?
Plans for taking Packard public were well underway in 1996. It is my belief that they viewed the software project as beyond their time horizon. They didn’t want to invest money in projects that they perceived would have a payback after the company was sold.
Another theory is that either they perceived the software project as primarily helping sell gamma counters which they perceived as being phased out.
It is more likely that Packard ownership had been in communication with EG&G in possible acquisition talks and their move to kill the project would be wasted money knowing that in the near future, all of Wallac’s technology would be available in the combined company.
Why was the newer 4-PL method not adopted for use in drug discovery?
I’ve been told that the primary reason is that changing the method now, after so many years of using the old algorithm to produce data, would make it difficult to compare today’s work to older data.
Further it was explained that in drug discovery, the ED50 parameter is not nearly as important to be highly accurate as it was for values in human clinical tests. It is really more of a “ballpark” estimate.
More importantly, any change like this would cost a lot of money to revalidate.
In Summary…
I will never really understand how this journey ended the way it did. I can only speculate. I am glad that I exited the organization when I did. Staying on another 5 years just to see my stock options end up as confetti would have been far worse.
If anyone is interested in the details of this research work, please contact me.